Thursday 26 May 2016

10 Best Cities for Young People to Get Rich -Eric McWhinnie


Source: iStock
Young person trying to get rich | Source: iStock
Getting ahead in today’s economy can feel like a never-ending journey, especially when you’re taking the first few steps. The path to financial stability is often paved with student loans, a sluggish job market, and a rental market that will have you considering living out of a car. Where young adults begin the journey can make all the difference.
Achieving the American Dream and more has increasingly become an uphill battle in the wake of the Great Recession. A study from Sentier Research finds the median annual household income totals $54,578, lower than the median of $55,179 in June 2009, when the recession ended and the so-called “economic recovery” began. Adding insult to injury, separate research from the Economic Policy Institute shows the greatest real wage losses over the past two years come from workers with a college or advanced degree. Workers with a four-year college degree saw their hourly wages fall 1.3% from 2013 to 2014. Those with an advanced degree saw an hourly wage decline of 2.2%.
On a positive note, wage growth recently hit its best level in six years, and fewer employed Americans are worried about wage reduction. According to Gallup, only one in five employed workers say they are worried their wages will be cut in the near future, the lowest number since 2008. Nonetheless, location plays a significant factor in your finances and how you feel about them.
Money Under 30 analyzed cities across the United States to find the ideal combinations of modest expenses and decent salaries. The site looked at these two factors to find which locations allow young adults to earn and save at the same time. After all, it’s not how much you make, it’s how much you keep.
Let’s take a look at the 10 best cities in America for young adults to get rich.

10. Kansas City, Mo.

  • Metro population: 1,552,939
  • Median income (with a bachelor’s or higher): $50,853
  • Young people making more than $35,000 per year: 46%
  • Median rent per month: $851

9. Lancaster, Pa.

  • Metro population: 395,988
  • Median income (with a bachelor’s or higher): $50,057
  • Young people making more than $35,000 per year: 46%
  • Median rent per month: $892

8. Cincinnati, Ohio/Covington, Ky. area

  • Metro population: 1,616,183
  • Median income (with a bachelor’s or higher): $51,455
  • Young people making more than $35,000 per year: 47%
  • Median rent per month: $753

7. Ogden-Layton, Utah

  • Metro population: 574,291
  • Median income (with a bachelor’s or higher): $47,956
  • Young people making more than $35,000 per year: 48%
  • Median rent per month: $858

6. Harrisburg, Pa.

  • Metro population: 441,902
  • Median income (with a bachelor’s or higher): $47,211
  • Young people making more than $35,000 per year: 49%
  • Median rent per month: $862

5. Cedar Rapids, Iowa

  • Metro population: 177,529
  • Median income (with a bachelor’s or higher): $50,675
  • Young people making more than $35,000 per year: 50%
  • Median rent per month: $711

4. Des Moines, Iowa

  • Metro population: 475,796
  • Median income (with a bachelor’s or higher): $56,113
  • Young people making more than $35,000 per year: 52%
  • Median rent per month: $824

3. Shreveport, La.

  • Metro population: 297,931
  • Median income (with a bachelor’s or higher): $60,331
  • Young people making more than $35,000 per year: 53%
  • Median rent per month: $841

2. Springfield, Ill.

  • Metro population: 158,529
  • Median income (with a bachelor’s or higher): $65,367
  • Young people making more than $35,000 per year: 59%
  • Median rent per month: $742

1. South Bend, Ind.

  • Metro population: 268,291
  • Median income (with a bachelor’s or higher): $71,829
  • Young people making more than $35,000 per year: 65%
  • Median rent per month: $720

More from Culture Cheat Sheet

Wednesday 25 May 2016

The Surprising Facts About How Millennials Spend Money -Sheiresa Ngo


Young millennials having fun
<a href="http://us-ads.openx.net/w/1.0/rc?cs=07f189b5e0&cb=1464158340929&url=http%3A%2F%2Fwww.cheatsheet.com%2Fmoney-career%2Fsurprising-facts-millennial-discretionary-spending.html%2F%3Fa%3Dviewall&c.width=749&c.height=109&c.tag_id=21781&c.taglink_id=33490&c.scale=0.97196263&c.url=http%3A%2F%2Fwww.cheatsheet.com%2Fmoney-career%2Fsurprising-facts-millennial-discretionary-spending.html%2F%3Fa%3Dviewall&c.params=&c.impression_type=26&c.placement_id=ad0.2829461015843131" ><img src="http://us-ads.openx.net/w/1.0/ai?auid=538013270&cs=07f189b5e0&cb=1464158340929&url=http%3A%2F%2Fwww.cheatsheet.com%2Fmoney-career%2Fsurprising-facts-millennial-discretionary-spending.html%2F%3Fa%3Dviewall&c.width=749&c.height=109&c.tag_id=21781&c.taglink_id=33490&c.scale=0.97196263&c.url=http%3A%2F%2Fwww.cheatsheet.com%2Fmoney-career%2Fsurprising-facts-millennial-discretionary-spending.html%2F%3Fa%3Dviewall&c.params=&c.impression_type=26&c.placement_id=ad0.2829461015843131" border="0" alt=""></a>
Miillennials | Source: iStock
Wouldn’t it be great to go out a lot without breaking the bank? Well, millennials are doing just that. A new survey by TD Bank revealed that millennials go out the most when compared with Gen Xers and baby boomers, but they’re spending the least.
TD Bank’s national Consumer Spending Index took a look at the monthly spending habits of consumers as well as their preference when it came to making payments. Researchers found that although millennials make more discretionary purchases and go out twice as much as other age groups, they spend up to 27% less. In addition, millennials are relying less on credit than the other two generations. Instead, millennials are spending more with debit, cash, and checks than with credit cards.
American consumers shell out an average of $1,000 each month on discretionary items like eating out, buying clothes, and travel, and roughly $1,600 each month on bills such as rent or mortgage payments. This comes up to a grand total of $32,000 annually (excluding car payments, debt repayments, or healthcare). Millennials, however, spend about $26,000 annually, which is 27% less than Generation X and 23% less than baby boomers.
Millennials are doing a good job of being frugal, but Julie Pukas, head of U.S. bankcard and merchant solutions at TD Bank, said sometimes skipping the credit cards isn’t a good idea. Some millennials could be leaving valuable credit card rewards on the table. “Surprisingly, younger Americans are spending more with debit, cash, and checks than credit. These payment methods are certainly necessary, but without a balanced spend on credit consumers are passing up cash rewards and the opportunity to build their credit profile. For those who dine out, shop and go out frequently, strategically using credit for those purchases can impact your overall budget,” said Pukas.

Key findings

Group of friends having fun | Source: Thinkstock
<a href="http://us-ads.openx.net/w/1.0/rc?cs=07f189b5e0&cb=1464158341363&url=http%3A%2F%2Fwww.cheatsheet.com%2Fmoney-career%2Fsurprising-facts-millennial-discretionary-spending.html%2F%3Fa%3Dviewall&c.width=749&c.height=109&c.tag_id=21781&c.taglink_id=33490&c.scale=0.97196263&c.url=http%3A%2F%2Fwww.cheatsheet.com%2Fmoney-career%2Fsurprising-facts-millennial-discretionary-spending.html%2F%3Fa%3Dviewall&c.params=&c.impression_type=26&c.placement_id=ad0.8823705965519604" ><img src="http://us-ads.openx.net/w/1.0/ai?auid=538013270&cs=07f189b5e0&cb=1464158341363&url=http%3A%2F%2Fwww.cheatsheet.com%2Fmoney-career%2Fsurprising-facts-millennial-discretionary-spending.html%2F%3Fa%3Dviewall&c.width=749&c.height=109&c.tag_id=21781&c.taglink_id=33490&c.scale=0.97196263&c.url=http%3A%2F%2Fwww.cheatsheet.com%2Fmoney-career%2Fsurprising-facts-millennial-discretionary-spending.html%2F%3Fa%3Dviewall&c.params=&c.impression_type=26&c.placement_id=ad0.8823705965519604" border="0" alt=""></a>
Group of millennials | Source: Thinkstock
  • Millennials spent an average of $26,000 a year on discretionary purchases, such as eating out and travel. This is $6,000 less per year than the average consumer.
  • Millennials tend to use cash, a debit card and checks for half of their monthly spending and charge just 30% of their purchases.
  • Millennials love their coffee. The only category where millennials spent more money than Generation X and baby boomers is on coffee and fast food.

How you can spend less

The TD Bank study revealed that even though millennials made more purchases on retail goods and eating out than the two other generations in this study, their overall spending was lower. If your spending habits aren’t quite as good as the millennials in this study, how can you become more like them? Here’s how:

1. Keep tabs on spending

If you want to spend less, you’ll have to first take stock of how much money is going into and out of your household. Resolve to track your spending for at least 30 days. Write down everything you purchase, even if it’s something small like a pack of gum or bottled water. By the end of the month, you’ll be amazed to see that you were probably spending a lot more than you realized.

2. Set up a realistic budget

Now that you know how much money you’re spending, it’s time to sit down and draft a budget. Once you know how much money you have allotted for each area, resolve to stick to it. You may even want to carry your budget around with you so that you can reduce the temptation to overspend.

3. Get a savings buddy

Tell a close friend or family member about your goal to spend less money. With a money buddy, you’ll be more likely to stick to your goals because someone will be holding you accountable.

Culled from Money & Career Cheat Sheet

Tuesday 24 May 2016

Think What You Could Do With Half a Million Dollars in Retirement-By Suzanne Woolley


Think What You Could Do With Half a Million Dollars in Retirement
Take the Orient Express! Trek in Bhutan! Pay for health care!
The projected tab for an average, healthy 65-year-old couple retiring this year, in lifetime premiums for Medicare Parts B and D and supplemental insurance, is $288,000, according to the HealthView Services 2016 Retirement Health Care Costs Data Report. Add in out-of-pocket expenses, including dental, hearing, and vision care, and the bill reaches $377,412.
That's in today's dollars. You want it in tomorrow's? Adjusting for inflation, the report projects the lifetime premium costs at $435,472. Add in deductibles, copayments, hearing, vision, and dental, and it's $567,903.

Millennials and Gen Xers, this means you, too. If you need more motivation to save for retirement, flipping through the 16-page report will do it. You'll find memorable facts like these:
  • A 65-year-old couple retiring this year would need 57 percent of their Social Security payments just to cover their health-care expenses. For a couple 10 years younger, with plans to retire in 2026, that jumps to 88 percent. For a 45-year-old couple, it's 116 percent. Younger people can do the ugly extrapolation from there.
  • From 2015 to 2016, retirement health-care costs are projected to jump 7.3 percent, partly because of a 16.1 percent rise in monthly Medicare Part B premiums (for doctors and preventive services) over that period, from $104.90 last year to $121.80 this year.
  • A 30-year-old woman who retires at 65 will face about $119,000 more in expenses than her male counterpart, the report forecasts. That's based on women living until age 91 and men living until 87. The figures, in today's dollars, are $548,098 for women and $429,466 for men.
  • For someone who retires this month, HealthView expects health-care inflation to average just over 5.1 percent annually for the next two decades. But "since supplemental insurance premiums are age-based, future retirees could face an additional annual 4.5 percent increase (or more) for supplemental plan coverage," the report said. 
  • The state you live in plays a big part in your Medicare Part D coverage (for prescription drugs) and cost. HealthView took costs based on the latest projections from the most popular supplemental plan, Plan F. It found, for example, a gap of 49 percent between premiums for the insurance in Hawaii and Massachusetts. The tally in Massachusetts for a 55-year-old retiring at 65 and living to 89 is $116,790. In Hawaii, it's $173,583. 
  • With lowered thresholds for Medicare means testing, starting in 2018, wealthier retirees will face increased surcharges on Parts B and D based on their modified adjusted gross income (yes, the acronym is MAGI). "Since the levels are not currently indexed to inflation," the report says, "as salaries grow over time many middle-class retirees may eventually fall into upper MAGI brackets and face even higher surcharges."      

Culled  from Bloomberg.com

Monday 23 May 2016

10 Retirement Statistics That Will Scare the Crap Out of You-Eric McWhinnie


Scream scene
<a href="http://us-ads.openx.net/w/1.0/rc?cs=07f189b5e0&cb=1463985935940&url=http%3A%2F%2Fwww.cheatsheet.com%2Fmoney-career%2F10-retirement-statistics-will-scare-crap.html%2F%3Fa%3Dviewall&c.width=749&c.height=109&c.tag_id=21781&c.taglink_id=33490&c.scale=0.97196263&c.url=http%3A%2F%2Fwww.cheatsheet.com%2Fmoney-career%2F10-retirement-statistics-will-scare-crap.html%2F%3Fa%3Dviewall&c.params=&c.impression_type=26&c.placement_id=ad0.14374830257748072" ><img src="http://us-ads.openx.net/w/1.0/ai?auid=538013270&cs=07f189b5e0&cb=1463985935940&url=http%3A%2F%2Fwww.cheatsheet.com%2Fmoney-career%2F10-retirement-statistics-will-scare-crap.html%2F%3Fa%3Dviewall&c.width=749&c.height=109&c.tag_id=21781&c.taglink_id=33490&c.scale=0.97196263&c.url=http%3A%2F%2Fwww.cheatsheet.com%2Fmoney-career%2F10-retirement-statistics-will-scare-crap.html%2F%3Fa%3Dviewall&c.params=&c.impression_type=26&c.placement_id=ad0.14374830257748072" border="0" alt=""></a>
Scary retirement statistics | Source: Dimension Films
America’s retirement crisis is the most gruesome wreck you’ll find on Main Street. New victims are discovered every day amid a financial bloodbath of too much debt, not enough savings, and stalled wages. We can’t look away — nor should we.
More than ever, you need to take an active role in preparing your future self for a time when you’ll want or need to retire. The company-pension airbag is officially deflated. In 1974, the original IRA was introduced after Congress passed the Employee Retirement Income Security Act. Four years later, the IRS added a little paragraph to the tax code that led to the first 401(k) being created in 1981. Today, IRA and 401(K) retirement accounts have replaced pensions, with one glaring downside: They are do-it-yourself retirement plans.
When faced with a choice on a seemingly complex subject such as saving for retirement, individuals often take the default or “no decision” choice. In the case of voluntary retirement plans, which require participants to take action in order to save money, the “no decision” choice is a decision not to save. This is slowly changing as more employers are automatically enrolling workers into 401(k) plans, but if you need a good scare to get you interested in your own retirement, we’ve assembled a list of the scariest retirement statistics.
Let’s take a look at 10 retirement statistics that will scare the crap out of you, and hopefully get you thinking about saving more for your future self.

1. Nothing saved for retirement

Your mama may have told you to be happy with what you’ve got, but that isn’t much if we’re talking about retirement savings. A recent survey from GoBankingRates.com finds more than half of Americans have less than $10,000 saved for retirement, with one in three having nothing saved. The National Institute on Retirement Security estimates the nation’s retirement savings gap is between $6.8 and $14 trillion.
Exactly how much you need to save for retirement is an ongoing debate, but one thing is clear: You’ll need more than nothing.

2. Healthcare costs are sickening in retirement

Health truly equals wealth in retirement. Research from Fidelity says a couple that retired in 2015, both aged 65, can expect to spend an estimated $245,000 on healthcare throughout retirement. That’s up from $220,000 in 2014 and $190,000 in 2005. Longer life expectancies and anticipated annual increases for medical and prescription expenses are the primary factors raising the bill.
“The sticker shock of $245,000 hopefully reinforces for many people that they need to act now, regardless of their age,” said Brad Kimler, executive vice president of Fidelity’s Benefits Consulting Services, in a press release. “For people offered a high-deductible health plan with a health savings account at work, choosing this option can really help them prepare, especially for Millennials who have a long time to save.”

3. You might be in it for the retirement long haul

Once you hit age 65, roughly the average retirement age, your odds of living for another decade or two is quite high. Men age 65 today have a 78% chance of living another 10 years, while women have an 85% chance, according to research from JPMorgan. The odds of a long life increase dramatically for couples. In fact, couples age 65 today have an astounding 97% chance that at least one of them lives another 10 years and an 89% chance that one experiences their 80-year birthday. It almost comes down to a coin flip that at least one person in the relationship lives to 90.
In short, you should plan on living to at least 90 or perhaps even longer, depending on your family history. I once had an Ameriprise financial planner tell me he usually assumes his clients are going to live to be 100, just to be on the safe side.

4. Student loans could come back to haunt your golden years

Millennials know all too well the financial burden of college debt. Recent findings from the LIMRA Secure Retirement Institute reveal that millennials who start their careers with $30,000 in student loans could find have $325,000 less in retirement savings compared to debt-free peers. This is a fairly typical debt load for student debt. In 2015, the average student loan debt totaled $33,000, compared to $10,000 in 1990.
Debt isn’t always terrible. In fact, debt is merely borrowing from your future self. It can be a wise investment if it leads to a significant increase in your earning potential. The trick is researching career options ahead of time and realizing there are ways to reduce how much you spend on a college degree. Financial aid, scholarships, technical degrees, and community colleges may all help dampen the impact of education costs. At least six different student loan forgiveness programs exist to help you erase college debt.

5. Financial literacy took a detour

I’m reminded of a quote from Mickey Mantle: “It’s unbelievable how much you don’t know about the game you’ve been playing all your life.”
It’s unbelievable how much people don’t know about an object they’ve been trying to acquire all their life. Standard & Poor’s conducted interviews with over 150,000 adults in more than 140 countries to gauge global financial literacy. The results are painful. Only 33% of adults worldwide are able to correctly answer at least three out of four financial concepts involving risk diversification, inflation, numeracy, and compound interest. That means around 3.5 billion adults globally, most of them in developing economies, lack an understanding of basic financial concepts.
A lack of understanding creates an abundance of uncertainty and stress, which helps explain why 60% of employees report feeling somewhat or very stressed about their financial situations, or why 62% of millennials want a financial advisor to walk them through every step of the retirement planning process.

6. Millions miss out on “free” retirement money

We need all the help we can get when it comes to saving for retirement. Unfortunately, millions of Americans aren’t doing themselves any favors. According to Financial Engines, an independent investment advisor, one quarter of employees are not saving enough money to receive their employer’s 401(k) match. On average, those employees are missing out on an extra $1,336 a year, or a little less than an extra $25 a week. Overall, Americans are losing an estimated $24 billion every year in matching contributions.
Wait, it gets worse. Retirement savers are also leaving money on the table with the Saver’s Credit. Only 25% of American workers with annual household incomes of less than $50,000 are aware of the tax credit, which is a benefit available to low- and moderate-income workers saving for retirement. The credit reduces a taxpayer’s federal income tax and may be applied to the first $2,000 ($4,000 if married and filing jointly) of voluntary contributions an eligible worker makes to a 401(k), 403(b), or similar employer-sponsored retirement plan, or an individual retirement account (IRA).
It’s not always easy to contribute to your retirement accounts, and there’s always an excuse to not do something, but nobody cares about your future self like you. If you’re having trouble deciding how to tackle your savings strategy, check out our Savings 101: Your Cheat Sheet to Financial Security.

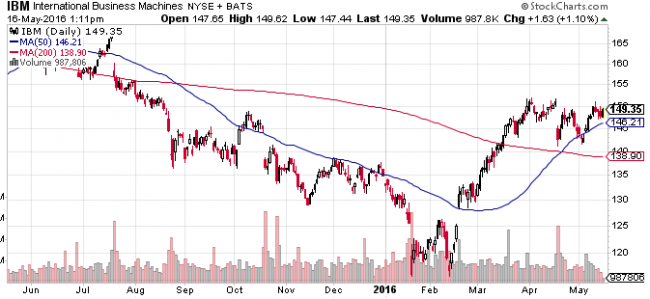
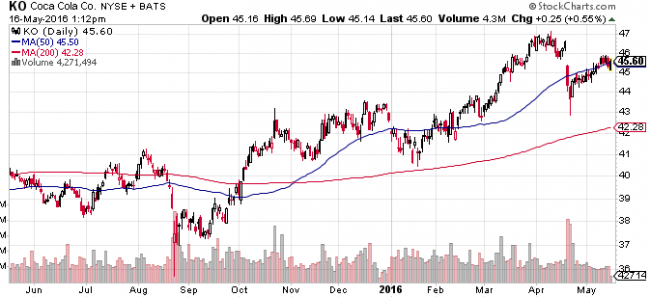
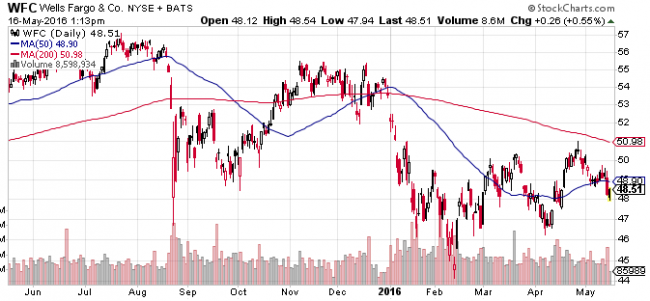
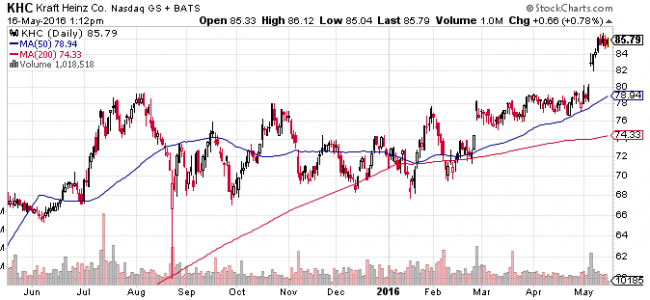
7. The market can be a slug sometimes

The stock market has three directions: up, down, and sideways. If investing in stocks is part of your retirement plan, building wealth can feel like slow process when the market isn’t moving up in a nice, straight line. Your retirement balances may even move backwards from time to time.
Fidelity’s analysis of retirement accounts reveal that average balances dipped in the beginning of 2016. The average 401(k) balance fell from $91,800 in the first quarter of 2015 to $87,300 in the first quarter of 2016. The average IRA balance fell from $94,100 to $89,300 over the same period. These declines are due to the stock market’s worst new-year start in history, which is why it’s vital that you think of investing as a multi-decade process, and not get caught up in short-term volatility.

8. Fees can rob your retirement blind

Retirement fees
<a href="http://us-ads.openx.net/w/1.0/rc?cs=07f189b5e0&cb=1463985936546&url=http%3A%2F%2Fwww.cheatsheet.com%2Fmoney-career%2F10-retirement-statistics-will-scare-crap.html%2F%3Fa%3Dviewall&c.width=642&c.height=95&c.tag_id=21781&c.taglink_id=33490&c.scale=1.1339564&c.url=http%3A%2F%2Fwww.cheatsheet.com%2Fmoney-career%2F10-retirement-statistics-will-scare-crap.html%2F%3Fa%3Dviewall&c.params=&c.impression_type=26&c.placement_id=ad0.19788078805479004" ><img src="http://us-ads.openx.net/w/1.0/ai?auid=538013270&cs=07f189b5e0&cb=1463985936546&url=http%3A%2F%2Fwww.cheatsheet.com%2Fmoney-career%2F10-retirement-statistics-will-scare-crap.html%2F%3Fa%3Dviewall&c.width=642&c.height=95&c.tag_id=21781&c.taglink_id=33490&c.scale=1.1339564&c.url=http%3A%2F%2Fwww.cheatsheet.com%2Fmoney-career%2F10-retirement-statistics-will-scare-crap.html%2F%3Fa%3Dviewall&c.params=&c.impression_type=26&c.placement_id=ad0.19788078805479004" border="0" alt=""></a>
Retirement fees | Source: FutureAdvisor
Life is full of fees: convenience fees, installation fees, cancellation fees, ATM fees, checked-bag fees, it never ends. Most of the time these fees are expressed in dollar signs, unless we’re talking about investing fees. Wall Street has some of the most elusive fee disclosures you’ll find. Instead of dollar signs, expense ratios (the most common fees in retirement accounts) are expressed as percentages. For example, an expense ratio of 1.25% sounds insignificant but in terms of dollars, that fee will cost you $125 annually for every $10,000 invested. Compounded over time, that adds up to staggering amounts. Making matters worse, you don’t see the fee subtracted from your balance statement. Instead, it’s subtracted from your market returns before your statement is even made.
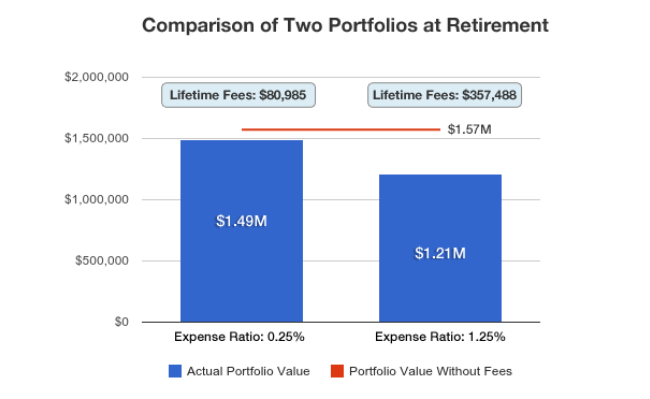
FutureAdvisor calculates how different expense ratios affect two identical 401(k) portfolios starting at $10,000, and receiving the maximum annual contribution for 40 years. The first portfolio has an expense ratio of only 0.25%. It reaches a value of $1.49 million, with $80,985 in lifetime fees paid. The second portfolio has an expense ratio of 1.25%. It reaches a value of $1.21 million. That’s still a nice payday, but lifetime fees totaled a whopping $357,488. You could have saved $276,503 by simply choosing a low-cost fund (all other things equal).
Lesson learned: Pay attention to fees. You don’t always get what you pay for on Wall Street. If you notice an abundance of high-cost funds in your 401(k), talk to your employer about switching providers. Some employers actually do care about their employees’ retirement options. Examples of low-cost providers include Ubiquity, Employer Fiduciary, and Vanguard.

9. You might not retire on your own terms

Not everyone will be able to work well into their 80s like Warren Buffett, or well into their 90s like his right-hand man Charlie Munger. Gallup finds the average retirement age is 62. This corresponds with the Center for Retirement Research at Boston’s research that finds the average retirement age is about 64 for men and 62 for women.
Retiring when you’re physically and financially able to enjoy life is great news, but that’s not always the case. In fact, 55% of retirees actually retired earlier than expected, with health reasons cited as the number one reason, followed by job loss. The third of workers expecting to never retire are in for a rude awakening. Don’t count on being able to work longer to make up for a lack of savings.

10. Social Security to become less sociable

Nobody knows what exactly Social Security will look like in a couple decades, but it will most likely be different in some capacity. Without some type of reform, benefits will need to be cut by 23% in aggregate in 2033, according to a recent report from the Social Security Administration. In other words, after the depletion of reserves, continuing tax income is expected to be sufficient enough to pay 77% of scheduled benefits in 2033.
Social Security is a lifeline to retirees. According to the Transamerica Center for Retirement Studies, Social Security is the most common cited source of income for retirees, with savings and investments at a distant second. The median age they started collecting benefits was 62. In fact, the Economic Policy Institute, a nonpartisan think tank, estimates that Social Security keeps nearly 27 million Americans above the poverty threshold, as gauged by the Supplemental Poverty Measure.

Culled from Money & Career Cheat Sheet

Wednesday 18 May 2016

No One Really Knows How Much Money to Save for Retirement-Eric McWhinnie


The famous game show with Regis Philbin
<a href="http://us-ads.openx.net/w/1.0/rc?cs=07f189b5e0&cb=1463554032563&url=http%3A%2F%2Fwww.cheatsheet.com%2Fmoney-career%2Fno-one-knows-how-much-money-to-save-for-retirement.html%2F%3Fa%3Dviewall&c.width=749&c.height=109&c.tag_id=21781&c.taglink_id=33490&c.scale=0.97196263&c.url=http%3A%2F%2Fwww.cheatsheet.com%2Fmoney-career%2Fno-one-knows-how-much-money-to-save-for-retirement.html%2F%3Fa%3Dviewall&c.params=&c.impression_type=26&c.placement_id=ad0.6693218261242015" ><img src="http://us-ads.openx.net/w/1.0/ai?auid=538013270&cs=07f189b5e0&cb=1463554032563&url=http%3A%2F%2Fwww.cheatsheet.com%2Fmoney-career%2Fno-one-knows-how-much-money-to-save-for-retirement.html%2F%3Fa%3Dviewall&c.width=749&c.height=109&c.tag_id=21781&c.taglink_id=33490&c.scale=0.97196263&c.url=http%3A%2F%2Fwww.cheatsheet.com%2Fmoney-career%2Fno-one-knows-how-much-money-to-save-for-retirement.html%2F%3Fa%3Dviewall&c.params=&c.impression_type=26&c.placement_id=ad0.6693218261242015" border="0" alt=""></a>
Who wants to be a retirement millionaire? | Source: ABC
It’s a money question that has no definitive answer: “How much should I save for retirement?” An exact figure is so elusive because everybody’s financial situation is different, and crystal balls are always cloudy if you look close enough. We routinely hear specific dollar amounts we’ll need to make sure we don’t tarnish our golden years, but are any of them right?
Back in the good old days, a million dollars was enough money for retirement and pretty much anything else you wanted from life. If you had a million dollars you were considered rich. You had enough financial independence to pursue your bucket list. Those days are seemingly long gone. Now, a million dollars feels like a starting point when trying to determine how much you’ll need for retirement. The general retirement calculation we’re told goes something like this: enjoyable retirement + health care costs + inflation = at least a $1 million nest egg. Never mind the details, just keep working, spending, and saving until you one day hit that million mark — or die trying.
You don’t have to look far to find evidence that Americans are listening to these colossal savings targets. A recent study from Transamerica Center for Retirement Studies (TCRS) finds 25% of workers estimate they’ll need at least $1 million to feel financially secure in retirement. Twenty-nine percent of workers, the largest group in the report, say they’ll need at least $2 million, representing a 53% surge in four years. In 2011, only 19% of workers said they’ll need at least a $2 million nest egg to feel financially secure in retirement.
Even reaching the $2 million mark may not be enough money for retirement, depending who you ask. American investors told Legg Mason, a global asset management firm, they’ll need an average of $2.5 million in retirement to enjoy the quality of life they have today. Before you know it, the new retirement number will be $3 million, or perhaps $5 million, just to be on the safe side.
I think it’s fair to say many of us will not save $1 million or more for retirement. In fact, when we hear figures like these, which often ignore our own personal situations, they can cause us to feel hopeless and give up on the retirement saving process altogether. Over half of Americans have less than $10,000 saved for retirement, and about 75% of Americans over 40 are behind on saving for retirement, according to GoBankingRates. Meanwhile, the average 401(k) and IRA balances at Fidelity totaled only $87,900 and $90,100, respectively, at the end of 2015. However, you probably don’t need $1 million to retire either.
Instead of becoming overwhelmed by how many millions you’re told you should have before retiring, start with the other side of the equation, your expenses. More specifically, focus on the expenses you can control. You really don’t know how much money you’ll need for retirement until you pay attention to your expenses. Naturally, the less money you spend on an annual basis, the less money you’ll need to retire.
It’s not a matter of sheer luck that some people are able to retire early, or retire with significantly less than $1 million. These people understand that your expenses determine if you can truly afford retirement. If you spend only $30,000 a year, compared to the Joneses who spend $60,000 a year, you don’t need to save as much as the Joneses. For example, multiplying your annual expenses by 25 is one of the simplest — yet helpful — retirement planning calculations in existence.
If you spend $30,000 per year, you would need roughly $750,000 in income producing assets, compared to $1.5 million needed if you spend $60,000 a year and plan to continue spending that much throughout retirement. Note these calculations ignore Social Security payments, which will likely be around in some capacity when you retire.
The 25-times-your-annual-expenses rule certainly isn’t perfect, but it’s a realistic start to knowing how much you should save for retirement. Sure, we don’t know exactly how much we’ll spend on an annual basis in the future, but most of us can cut several major expenses like housing, transportation, and food if we truly tried. Tax strategies can be learned to maximize savings, and side jobs or alternative sources of monthly income like real estate can reduce our retirement numbers even more. The responsibility to make your golden years shine are on you.

Culled from Money & Career Cheat Sheet

Tuesday 17 May 2016

Warren Buffett Bets Big on These 7 Stocks for 2016-Eric McWhinnie

Warren Buffett talking
<a href="http://us-ads.openx.net/w/1.0/rc?cs=07f189b5e0&cb=1463466467102&url=http%3A%2F%2Fwww.cheatsheet.com%2Fpersonal-finance%2Fwarren-buffetts-top-7-favorite-stocks.html%2F%3Fa%3Dviewall&c.width=749&c.height=109&c.tag_id=21781&c.taglink_id=33490&c.scale=0.97196263&c.url=http%3A%2F%2Fwww.cheatsheet.com%2Fpersonal-finance%2Fwarren-buffetts-top-7-favorite-stocks.html%2F%3Fa%3Dviewall&c.params=&c.impression_type=26&c.placement_id=ad0.555851769413456" ><img src="http://us-ads.openx.net/w/1.0/ai?auid=538013270&cs=07f189b5e0&cb=1463466467102&url=http%3A%2F%2Fwww.cheatsheet.com%2Fpersonal-finance%2Fwarren-buffetts-top-7-favorite-stocks.html%2F%3Fa%3Dviewall&c.width=749&c.height=109&c.tag_id=21781&c.taglink_id=33490&c.scale=0.97196263&c.url=http%3A%2F%2Fwww.cheatsheet.com%2Fpersonal-finance%2Fwarren-buffetts-top-7-favorite-stocks.html%2F%3Fa%3Dviewall&c.params=&c.impression_type=26&c.placement_id=ad0.555851769413456" border="0" alt=""></a>
Warren Buffett | Drew Angerer/Getty Images
Warren Buffett is no stranger to multibillion-dollar investments. The Oracle of Omaha has been beating the market for decades while accumulating positions in some of the world’s most popular companies. Courtesy of a new filing, we now have a peek at how the legendary investor deployed capital in the first three months of 2016.
Many institutional investment managers recently filed their mandatory 13F with the Securities & Exchange Commission (SEC). The filing is a quarterly report of equity holdings required by managers who oversee more than $100 million in qualifying assets and must be filed within 45 days of the end of each quarter. The 13F provides a glance at what firms did in the previous quarter, but investors should keep in mind that hedging and trading strategies of each fund are still unknown.
Buffett’s Berkshire Hathaway made several changes in the three months ended March 31, 2016. The conglomerate reduced its stakes in Mastercard, Wal-Mart, and Procter & Gamble. In fact, its Procter & Gamble position was slashed from 52.8 million shares (worth $4.2 billion) at the end of 2015 to only 315,400 shares (worth $26 million) at the end of the first quarter, reflecting the Duracell swap announced in 2014. Berkshire Hathaway also sold off its $1.6 billion position in AT&T, but added a new $1.1 billion position in Apple, and increased its stakes in Bank of New York Mellon, Deere, Visa, and International Business Machines. The new Apple position was not purchased directly by Buffett.
The largest investments in Berkshire Hathaway’s portfolio include some of the most popular blue chips known to Wall Street. Let’s take a look at Berkshire Hathaway’s top seven holdings according to dollar value at the end of March, not including Buffett’s option to purchase 700 million shares of Bank of America at any time prior to September 2021 for $5 billion.

7. Wal-Mart

Wal-Mart stock price chart
<a href="http://us-ads.openx.net/w/1.0/rc?cs=07f189b5e0&cb=1463466467521&url=http%3A%2F%2Fwww.cheatsheet.com%2Fpersonal-finance%2Fwarren-buffetts-top-7-favorite-stocks.html%2F%3Fa%3Dviewall&c.width=642&c.height=95&c.tag_id=21781&c.taglink_id=33490&c.scale=1.1339564&c.url=http%3A%2F%2Fwww.cheatsheet.com%2Fpersonal-finance%2Fwarren-buffetts-top-7-favorite-stocks.html%2F%3Fa%3Dviewall&c.params=&c.impression_type=26&c.placement_id=ad0.8718103041320929" ><img src="http://us-ads.openx.net/w/1.0/ai?auid=538013270&cs=07f189b5e0&cb=1463466467521&url=http%3A%2F%2Fwww.cheatsheet.com%2Fpersonal-finance%2Fwarren-buffetts-top-7-favorite-stocks.html%2F%3Fa%3Dviewall&c.width=642&c.height=95&c.tag_id=21781&c.taglink_id=33490&c.scale=1.1339564&c.url=http%3A%2F%2Fwww.cheatsheet.com%2Fpersonal-finance%2Fwarren-buffetts-top-7-favorite-stocks.html%2F%3Fa%3Dviewall&c.params=&c.impression_type=26&c.placement_id=ad0.8718103041320929" border="0" alt=""></a>
WMT stock price | Source: Stockcharts.com
The famous discount retailer is Berkshire Hathaway’s seventh largest holding. While shares have trended higher in 2016, Berkshire Hathaway cut its position by almost 1 million shares. Buffett and company owned 55.2 million shares (worth $3.8 billion) at the end of the first quarter.

6. Phillips 66

Phillips 66 stock price | Source: Stockcharts.com
<a href="http://us-ads.openx.net/w/1.0/rc?cs=07f189b5e0&cb=1463466467522&url=http%3A%2F%2Fwww.cheatsheet.com%2Fpersonal-finance%2Fwarren-buffetts-top-7-favorite-stocks.html%2F%3Fa%3Dviewall&c.width=642&c.height=95&c.tag_id=21781&c.taglink_id=33490&c.scale=1.1339564&c.url=http%3A%2F%2Fwww.cheatsheet.com%2Fpersonal-finance%2Fwarren-buffetts-top-7-favorite-stocks.html%2F%3Fa%3Dviewall&c.params=&c.impression_type=26&c.placement_id=ad0.9665541142791588" ><img src="http://us-ads.openx.net/w/1.0/ai?auid=538013270&cs=07f189b5e0&cb=1463466467522&url=http%3A%2F%2Fwww.cheatsheet.com%2Fpersonal-finance%2Fwarren-buffetts-top-7-favorite-stocks.html%2F%3Fa%3Dviewall&c.width=642&c.height=95&c.tag_id=21781&c.taglink_id=33490&c.scale=1.1339564&c.url=http%3A%2F%2Fwww.cheatsheet.com%2Fpersonal-finance%2Fwarren-buffetts-top-7-favorite-stocks.html%2F%3Fa%3Dviewall&c.params=&c.impression_type=26&c.placement_id=ad0.9665541142791588" border="0" alt=""></a>
PSX stock price | Source: Stockcharts.com
The multinational American energy company was originally thought to be sold off by Buffett in the second quarter of 2015. As it turns out, Buffett had the stake classified as confidential so it wouldn’t show on the 13F and allow copycat investors to run the price up. At the end of March, Berkshire Hathaway held 75.6 million shares (worth $6.5 billion) of Phillips 66, up from 61.5 million shares in the previous quarter, according to the 13F.
Unlike oil giants Exxon Mobil and Chevron, Phillips 66 has escaped most of the carnage seen in the energy sector. Buffett told CNBC in September: “We’re buying it because we like the company and we like the management very much.” Berkshire Hathaway also has a relatively small position in Kinder Morgan, the largest energy infrastructure company in North America.

5. American Express

AXP stock price chart
<a href="http://us-ads.openx.net/w/1.0/rc?cs=07f189b5e0&cb=1463466467410&url=http%3A%2F%2Fwww.cheatsheet.com%2Fpersonal-finance%2Fwarren-buffetts-top-7-favorite-stocks.html%2F%3Fa%3Dviewall&c.width=642&c.height=95&c.tag_id=21781&c.taglink_id=33490&c.scale=1.1339564&c.url=http%3A%2F%2Fwww.cheatsheet.com%2Fpersonal-finance%2Fwarren-buffetts-top-7-favorite-stocks.html%2F%3Fa%3Dviewall&c.params=&c.impression_type=26&c.placement_id=ad0.206300618926337" ><img src="http://us-ads.openx.net/w/1.0/ai?auid=538013270&cs=07f189b5e0&cb=1463466467410&url=http%3A%2F%2Fwww.cheatsheet.com%2Fpersonal-finance%2Fwarren-buffetts-top-7-favorite-stocks.html%2F%3Fa%3Dviewall&c.width=642&c.height=95&c.tag_id=21781&c.taglink_id=33490&c.scale=1.1339564&c.url=http%3A%2F%2Fwww.cheatsheet.com%2Fpersonal-finance%2Fwarren-buffetts-top-7-favorite-stocks.html%2F%3Fa%3Dviewall&c.params=&c.impression_type=26&c.placement_id=ad0.206300618926337" border="0" alt=""></a>
AXP stock price | Source: Stockcharts.com
Financial services is a popular sector for Buffett. Berkshire Hathaway held 151.6 million shares of American Express at the end of March, unchanged from the prior quarter and worth $9.3 billion. Shares have stumbled over the past year.
Costco recently severed ties from American Express after 16 years in business with each other. American Express was able to make a deal with Sam’s Club, the other warehouse giant fighting for consumers, but it has done little to comfort Mr. Market. Berkshire Hathaway’s positions in Mastercard and Visa come no where close to the size of its American Express position.

4. IBM

IBM stock price chart
<a href="http://us-ads.openx.net/w/1.0/rc?cs=07f189b5e0&cb=1463466467625&url=http%3A%2F%2Fwww.cheatsheet.com%2Fpersonal-finance%2Fwarren-buffetts-top-7-favorite-stocks.html%2F%3Fa%3Dviewall&c.width=642&c.height=95&c.tag_id=21781&c.taglink_id=33490&c.scale=1.1339564&c.url=http%3A%2F%2Fwww.cheatsheet.com%2Fpersonal-finance%2Fwarren-buffetts-top-7-favorite-stocks.html%2F%3Fa%3Dviewall&c.params=&c.impression_type=26&c.placement_id=ad0.056997629428132024" ><img src="http://us-ads.openx.net/w/1.0/ai?auid=538013270&cs=07f189b5e0&cb=1463466467625&url=http%3A%2F%2Fwww.cheatsheet.com%2Fpersonal-finance%2Fwarren-buffetts-top-7-favorite-stocks.html%2F%3Fa%3Dviewall&c.width=642&c.height=95&c.tag_id=21781&c.taglink_id=33490&c.scale=1.1339564&c.url=http%3A%2F%2Fwww.cheatsheet.com%2Fpersonal-finance%2Fwarren-buffetts-top-7-favorite-stocks.html%2F%3Fa%3Dviewall&c.params=&c.impression_type=26&c.placement_id=ad0.056997629428132024" border="0" alt=""></a>
IBM stock price | Source: Stockcharts.com
If you’re looking for a reason not to follow in Buffett’s footsteps, IBM is it. The company was the worst performer in the Dow Jones Industrial Average in 2014, and one of the worst performers in 2015. In fact, shares have lost about 25% since hitting all-time highs above $200 in 2013, and revenue has fallen for 16 consecutive quarters. However, Buffett isn’t giving up. During the first quarter, Buffett increased his position slightly to 81.2 million shares, worth $12.3 billion. IBM is up about 8% this year, and has a dividend yield of 3.7%.

3. Coca-Cola

KO stock price chart
KO stock price | Source: Stockcharts.com
Coca-Cola is the most predictable position at Berkshire Hathaway. Buffett is on record saying he will never sell his shares in the world-renowned beverage company, and can often be seen holding a Cherry Coke. At the end of the first quarter, Berkshire Hathaway held the usual 400 million shares of Coca-Cola, worth $18.6 billion. That’s up from a value of $17.2 billion at the end of 2015. Shares have been regaining ground this year as investors seek stability and yield. Shares of Coca-Cola have a 3% dividend.
Coca-Cola has investments in Monster Beverage, Keurig Green Mountain, and Suja Juice. The company is also making operating changes to drive stronger growth and save $3 billion annually by 2019.

2. Wells Fargo

WFC stock price chart
WFC stock price | Source: Stockcharts.com
America’s most profitable bank is Buffett’s second biggest holding. Berkshire Hathaway held 479.7 million shares (worth $23.2 billion) of Wells Fargo at the end of the first quarter, unchanged from the previous quarter. Shares of Wells Fargo are in the red this year, but they pay a respectable dividend of 3.1%. In the most recent quarter, Wells Fargo announced net income of $5.5 billion, down from $5.8 billion a year earlier.

1. Kraft Heinz

KHC stock price chart
KHC stock price | Source: Stockcharts.com
Berkshire Hathaway’s position in the recently merged Kraft Heinz has been listed on the 13F for the past three quarters. Buffett teamed up with investment firm 3G Capital to takeover Kraft Foods with Heinz. The deal created one of the biggest food companies in history, with over 10 different brands valued at more than $500 million each. More recently, the company has laid of thousands of workers to cut costs and “consolidate manufacturing across the Kraft Heinz North American network.”
Buffett and company held 325.6 million shares of Kraft Heinz at the end of March, worth a whopping $25.6 billion. That makes Kraft Heinz Buffett’s largest portfolio holding.

Culled from Money & Career Cheat Sheet