
Retirement statistics | iStock.com
Millions of Americans are worried about their so-called golden years — with good reason. According to Bankrate.com, 28% of Americans say high medical bills are their top financial concern about retirement. Making matters worse, higher income provides little comfort. Households making more than $75,000 are actually more worried about medical expenses than the overall population. Meanwhile, 23% of Americans say running out of savings is their biggest financial concern, followed by 18% who say unaffordable daily expenses. Eleven percent of Americans are most worried about having too much debt in retirement.
With stagnant wages, rising living expenses, and an overall sluggish labor market, numerous obstacles face workers trying to save for retirement, but no one cares about your financial future as much as you. Let’s take a look at 10 charts that are crucial to the retirement planning process.
1. Savings rate
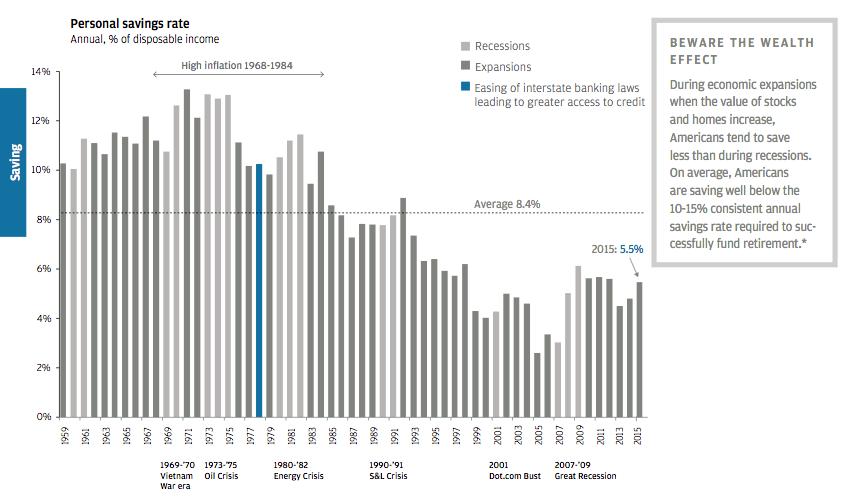
Personal savings | J.P. Morgan
As the chart above shows, the national savings rate has mostly declined for about the past 40 years. In 2014, the rate reached a dismal 4.8%, compared to a long-term average of 8.4%. The rate rebounded in a slightly less dismal 5.5% in 2015. J.P. Morgan finds that an alarming number of people are not even interested in saving. In 2015, only 48% had tried to calculate how much money they would actually need to save for retirement.
2. Life expectancy
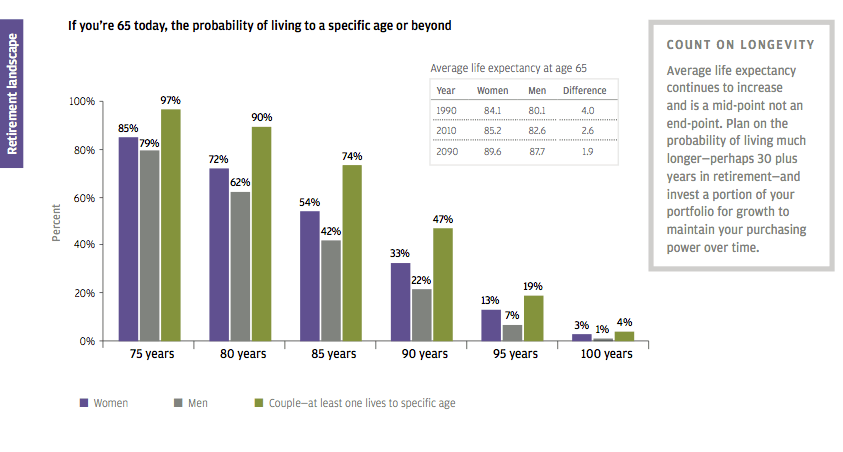
Life expectancy | J.P. Morgan
In fact, couples age 65 today have an astounding 97% chance that at least one of them lives another 10 years and an 90% chance that one experiences their 80-year birthday. It almost comes down to a coin flip that at least one person in the relationship lives to 90.
In short, you should plan on living to at least 90 years old or perhaps even longer, depending on your family history. While more people are working beyond the age of 65, that doesn’t mean you should assume you will be able to do so. J.P. Morgan finds that 67% of employed Americans plan to work beyond age 65, but only 23% of actual retirees did, citing health problems and employer issues.
3. Health care
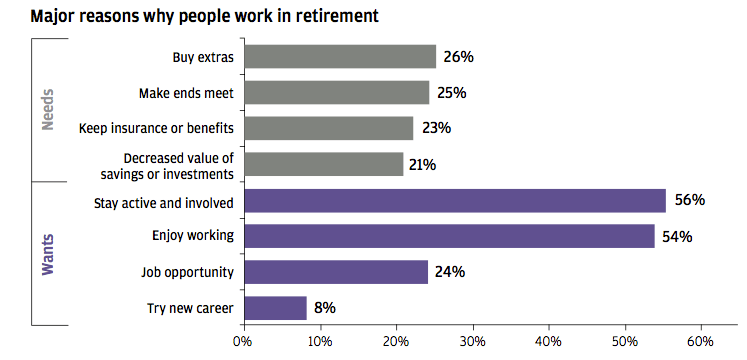
Retirement work | J.P. Morgan
How much might you spend on health care in retirement? A Fidelity analysis estimates a 65-year-old couple retiring in 2016 will need $260,000 to cover health care costs in retirement, excluding long-term care insurance. That’s up 6% from the $245,000 estimated for a couple retiring in 2015. The estimate applies to retirees with traditional Medicare insurance coverage and provides a general idea of the monthly expenses associated with Medicare premiums, Medicare co-payments and deductibles, and prescription drug out-of-pocket expenses.
4. Saving early

Save early for retirement | J.P. Morgan
Market returns are not guaranteed and are certainly more volatile than 7% each year, but the math shows the benefits of compounding returns. The earlier you start, the better your chances of reaching your financial goals. Your chances also improve if you start early and keep a consistent pace. A person who invests $5,000 annually between the ages of 25 and 65 could accumulate more than $1 million for retirement.
5. Spending habits
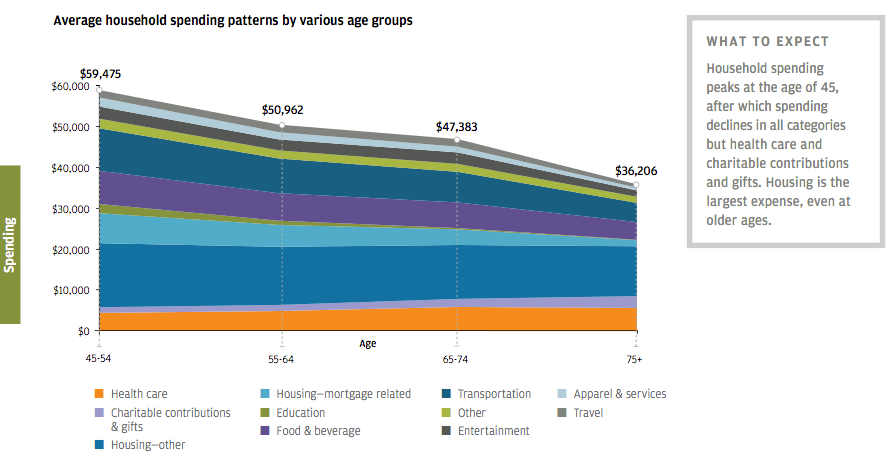
Retirement spending habits | J.P. Morgan
The average spending for 65- to 74-year-olds totals $47,383 per year — not exactly chump change. If you’re 35 today, imagine how much you’ll be spending in 30 years due to inflation. If you plan on traveling in retirement, your costs could be even higher. Additionally, healthcare is the one category of spending that fails to log a decrease. If you invest in nothing else for retirement, at least invest in your health. Eliminating mortgage debt and making sure your house fits your actual needs is also helpful in reducing retirement expenses, as housing-related costs represented the largest portion of spending among all age groups.
6. Nursing home expenses

Nursing home expenses | J.P. Morgan
Nearly 57% of Americans believe a year in a nursing home will cost them less than $75,000, according to a recent survey by MoneyRates.com. A study by MetLife finds that even semi-private rooms cost an average of $81,030 per year. Furthermore, the average cost of a semi-private room in the New York City area is $141,620, which is 75% higher than the national average. In contrast, Louisiana, Alabama, Oklahoma, and Missouri offer some of the cheapest long-term care services in the country.
7. Social Security
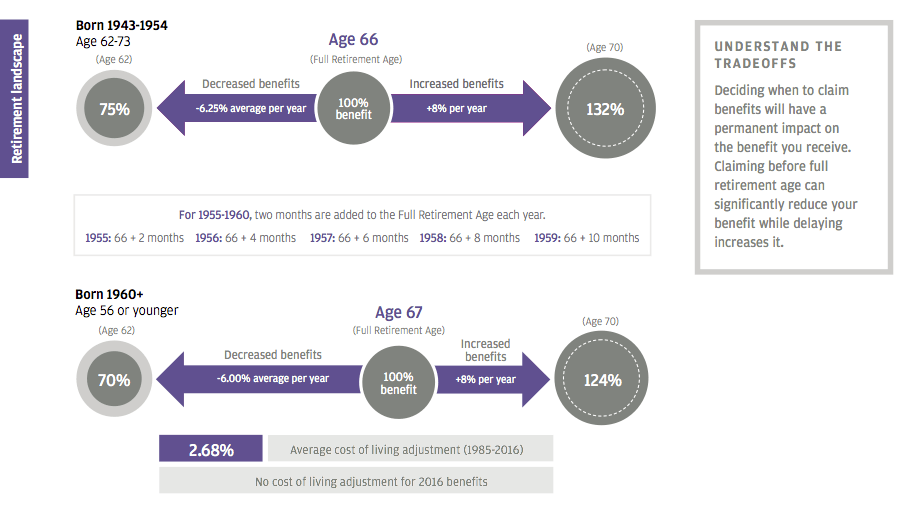
Social Security | J.P. Morgan
If you have a health problem or family history indicating you will not live for decades beyond age 62, you may want to claim Social Security as soon as possible so that you have time to enjoy the fruits of your labor. On the other hand, if your health and finances are stable, you may want to wait. The Social Security Administration now offers online accounts so that Americans can stay up to date on their financial situations.
8. Investing
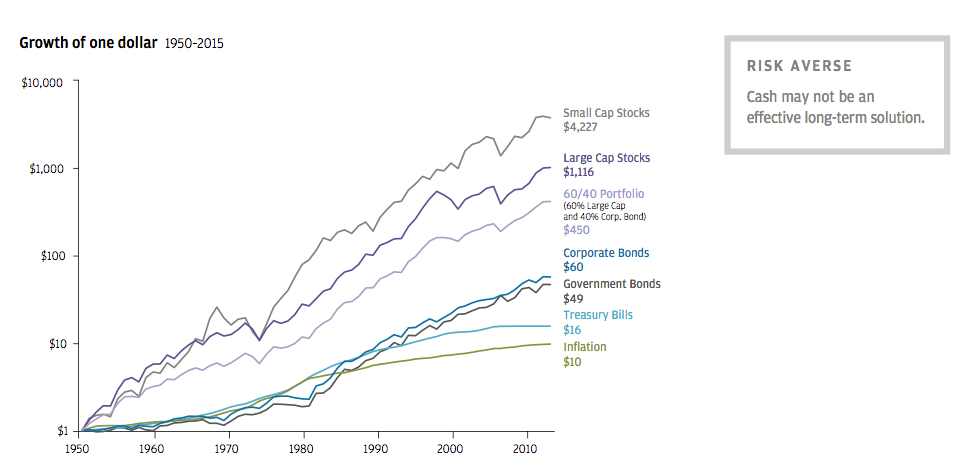
Investment growth | J.P. Morgan
Warren Buffett once explained how investors should view cash. He said:
“The one thing I will tell you is the worst investment you can have is cash. Everybody is talking about cash being king and all that sort of thing. Cash is going to become worth less over time. But good businesses are going to become worth more over time. And you don’t want to pay too much for them so you have to have some discipline about what you pay. But the thing to do is find a good business and stick with it. We always keep enough cash around so I feel very comfortable and don’t worry about sleeping at night. But it’s not because I like cash as an investment. Cash is a bad investment over time. But you always want to have enough so that nobody else can determine your future essentially.”
9. Market timing
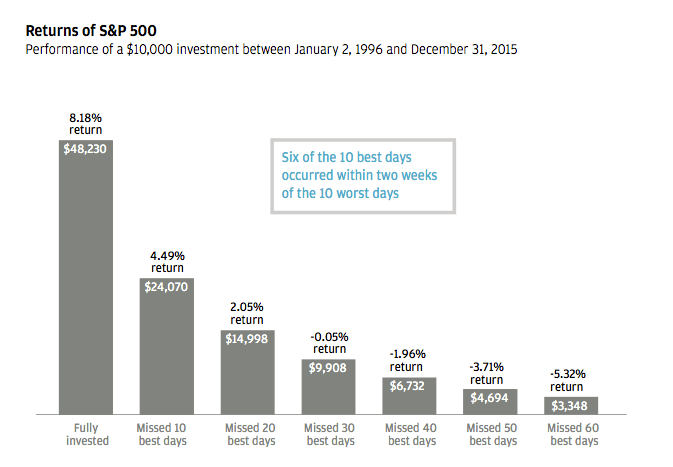
Market timing | J.P. Morgan
As the chart above shows, $10,000 invested between January 2, 1996, and December 31, 2015, would have grown to $48,230 if it was constantly invested in the S&P 500. If you missed the 10 best days during that period, the investment would have grown to only $24,070, just less than half of the amount if you simply left the money untouched. Critics rightly point out that missing the worst days in the market is even better for a portfolio, but that is a dangerous strategy for most investors.
Even if you rightly time the market and avoid the worst days, you are then left with the agonizing decision of when to get back into the market. You need to know yourself and your limitations when investing. Six of the 10 best days during the stated time period occurred within two weeks of the 10 worst days. The market is like a seesaw in the short-term, but becomes more stable through diversification and time.
10. Early withdrawals from retirement accounts
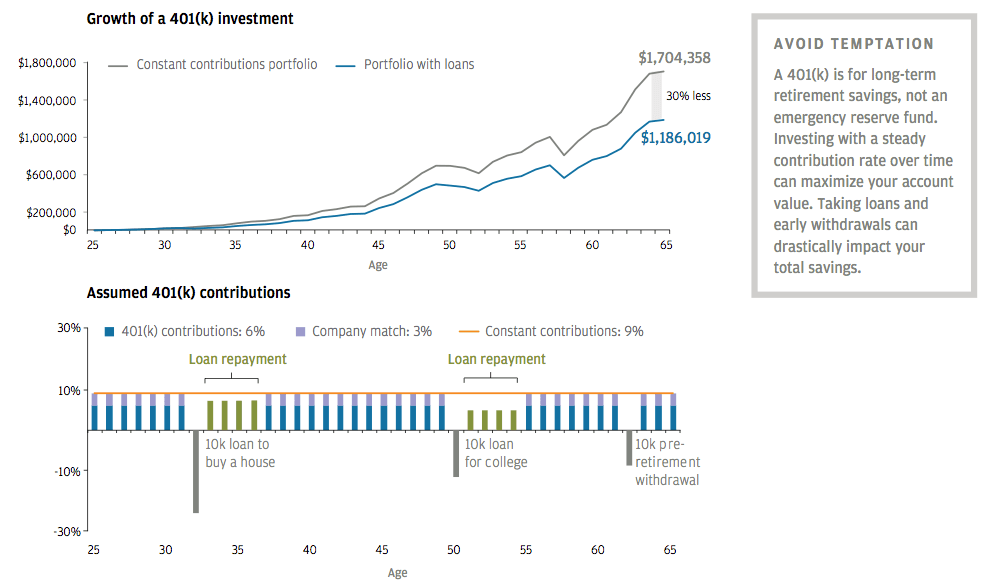
401(k) early withdrawals | J.P. Morgan
No comments:
Post a Comment